Referee Decision Patterns Unlock Value in League Fixtures
League matches often hinge on moments shaped by officials who bring distinct styles into each game, and analysts track these habits through detailed performance logs that reveal consistent tendencies across seasons. Data from domestic competitions shows how certain referees issue more cards in high-stakes derbies while others allow greater physical play before intervening, creating clear edges for those who study the patterns rather than relying on averages alone.
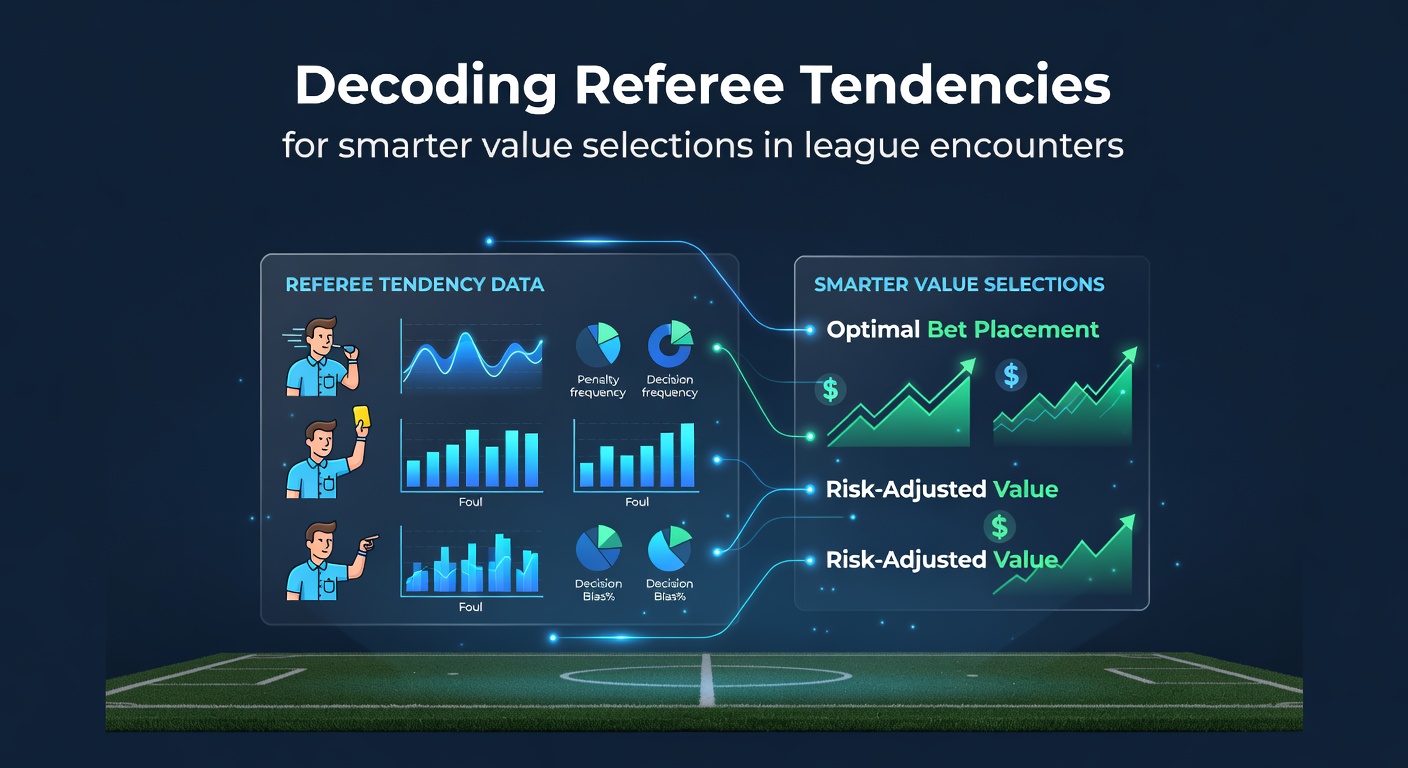
Core Metrics That Define Referee Styles
Yellow and red card averages form the foundation of most referee profiles, yet deeper figures such as fouls per game, penalty awards, and stoppage time distributions add layers that separate average selections from sharper ones. Researchers at sports analytics centers have compiled season-long datasets where officials average 4.8 yellow cards in top-flight encounters, though some climb above six while a smaller group stays under four, and these spreads become particularly useful when paired with team aggression ratings. Penalty frequency tells another story, because certain referees award them at rates double the league norm, especially in the final twenty minutes when fatigue increases contact inside the box.
What's interesting is how these numbers shift by competition phase. Early-season fixtures produce fewer cards overall since players test boundaries gradually, whereas May encounters often see spikes as title races tighten and officials face greater scrutiny from television replays. Observers note that fixture congestion periods also influence behavior, with midweek games sometimes featuring quicker whistles as referees manage player welfare alongside match flow.
League-Specific Variations and Data Layers
Each domestic league carries its own referee culture, and patterns emerge most clearly when comparing home versus away assignments. In several European top divisions, home teams receive fewer cards on average when familiar officials handle the game, while visiting sides encounter stricter enforcement on challenges that border the line. Australian A-League data mirrors this trend in a different climate, where high temperatures correlate with elevated foul counts and extended stoppage periods that reward teams comfortable in physical exchanges.
Take one study conducted across multiple seasons where experts isolated referees who consistently added over six minutes of added time in games decided by a single goal. Those officials created extra windows for late drama, and teams with strong bench options posted better results in such scenarios. The same research flagged a subset of officials whose second-yellow decisions clustered around the seventy-fifth minute, offering a narrow but repeatable window for in-play adjustments.

Integrating Referee Data Into Selection Processes
Value emerges when bettors cross-reference referee profiles against team tendencies rather than treating each element in isolation. A side that concedes many fouls in the final third becomes more vulnerable against officials who award penalties at above-average rates, and historical head-to-head records often highlight these overlaps before kickoff. Data providers now release weekly referee previews that include recent card counts, average stoppage times, and disciplinary records against specific clubs, allowing selections to move beyond broad league averages.
Yet the real edge appears in live markets. When an official issues an early yellow for a minor challenge, the likelihood of a second card rises measurably later, and teams aware of this shift adjust their pressing intensity accordingly. Multiple tracking platforms have documented how such early signals alter second-half outcomes, particularly in matches involving sides that rely on high defensive lines.
Seasonal Shifts and Upcoming Calendar Notes
Referee assignments rotate throughout the campaign, and leagues release updated lists that allow forward planning. As the 2025-26 season moves toward its closing weeks, several competitions will see familiar officials handle crucial fixtures in May 2026, when fatigue and motivation levels peak. Historical records indicate that officials with experience in these pressure situations tend to maintain consistent card rates rather than overcompensating, which keeps their profiles reliable for accumulator construction.
Training updates from governing bodies also influence behavior. Recent emphasis on player safety has led to stricter enforcement around head contact, and leagues that adopted these protocols early show measurable increases in cards for high challenges. Those adjustments appear most pronounced in physical leagues where aerial duels decide many outcomes.
Conclusion
Referee tendencies supply measurable context that refines value assessments across league schedules, and the most effective approaches combine historical card rates, penalty distributions, and stoppage patterns with current team form. As more granular data becomes available through official channels and independent analysts, those who track official assignments gain repeatable edges that compound over a full season of fixtures.